What's It Look Like On the Lake?
Page Edited Last 2025-03-06
Copyright 2021, 2025 David C Brezina
Email Information about Dead or New Links to dbrezina@rcn.com
- Harrison Dever Crib and Webcam Four Mile Crib (GLERL/NOAA)
- http://www.glerl.noaa.gov/metdata/chi/
NOTE: MUCH OF THE DATA ON LAKE MICHIGAN IS UNAVAILABLE IN THE WINTER BECAUSE OF HARD WATER (LITERALLY!)
Playpen Navy Pier https://www.glerl.noaa.gov/metdata/chi/chi01-tn.jpg?2202251630 Harbor Entrance The URL may have changed and you need to go to the Harrison Dever Crib and Webcam Four Mile Crib (GLERL/NOAA) to see all three.
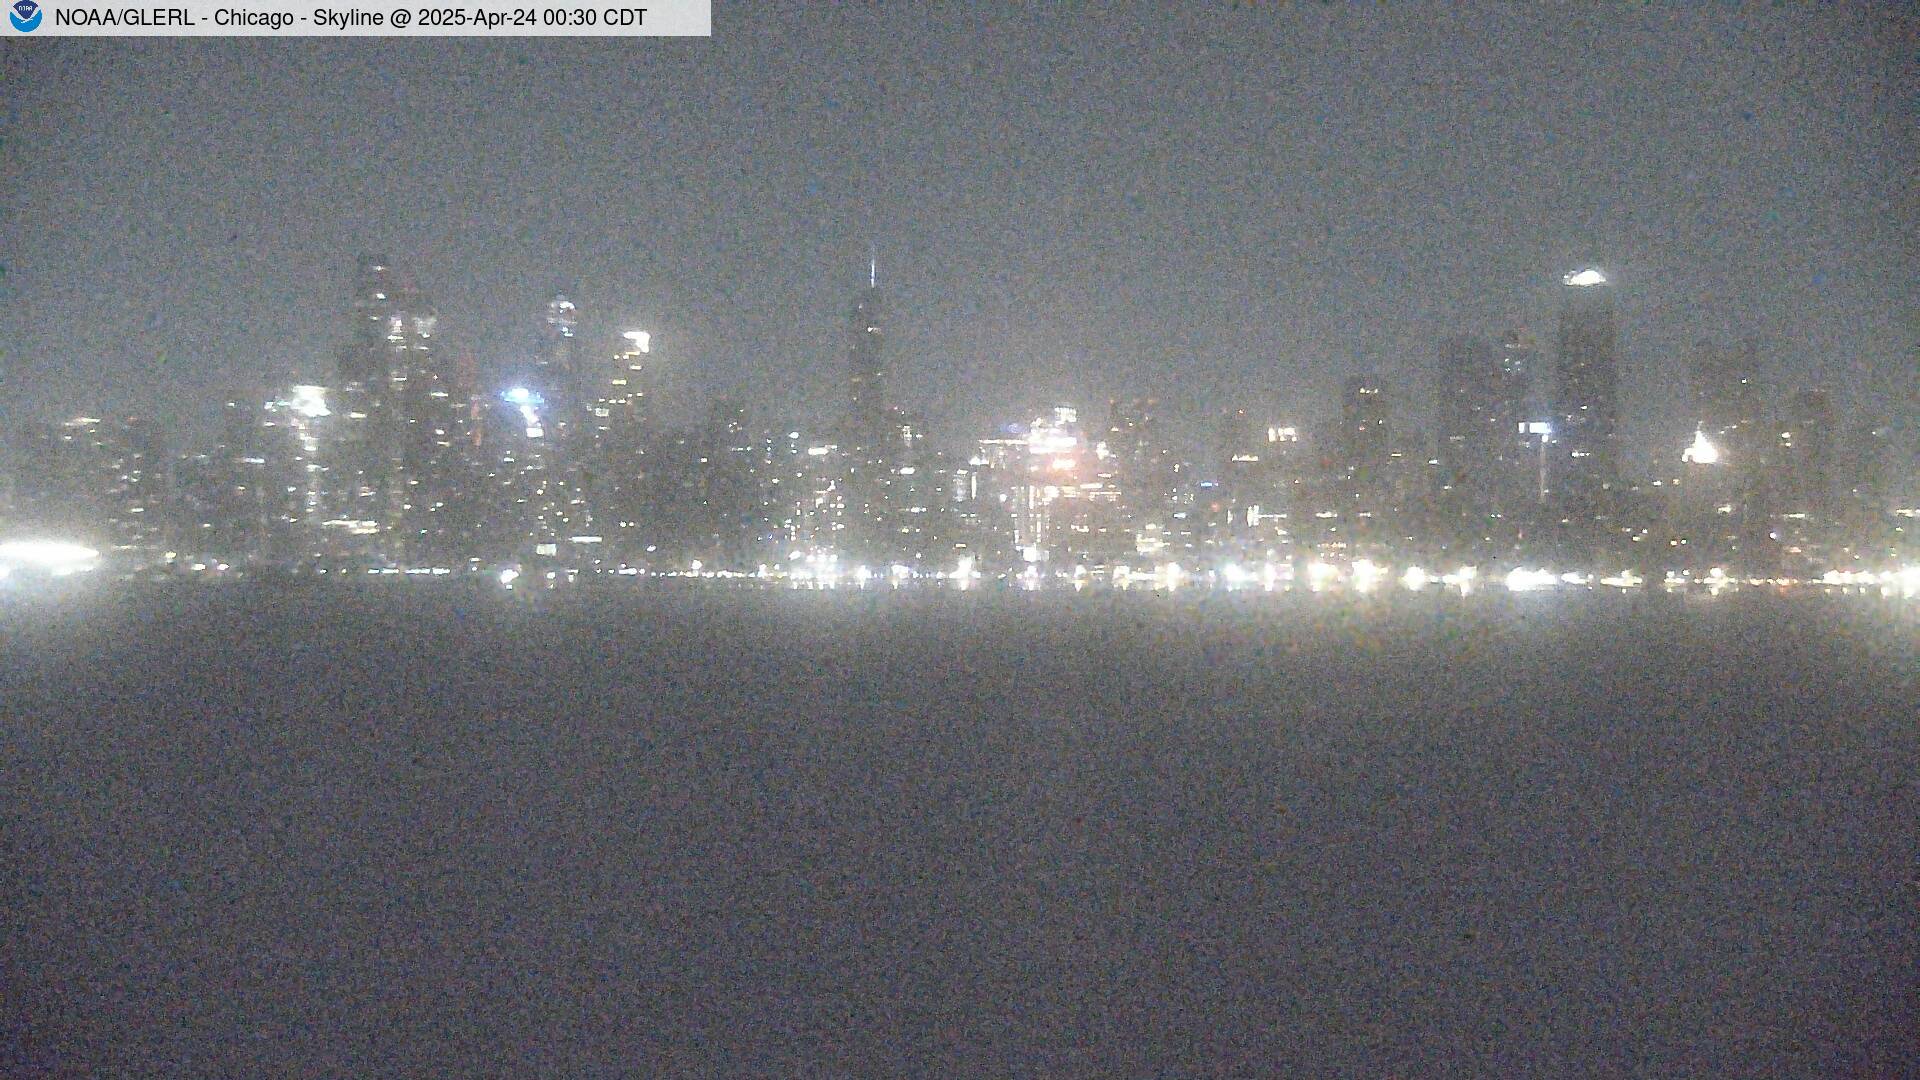
The URL may have changed and you need to go to the Harrison Dever Crib and Webcam Four Mile Crib (GLERL/NOAA) to see all three. 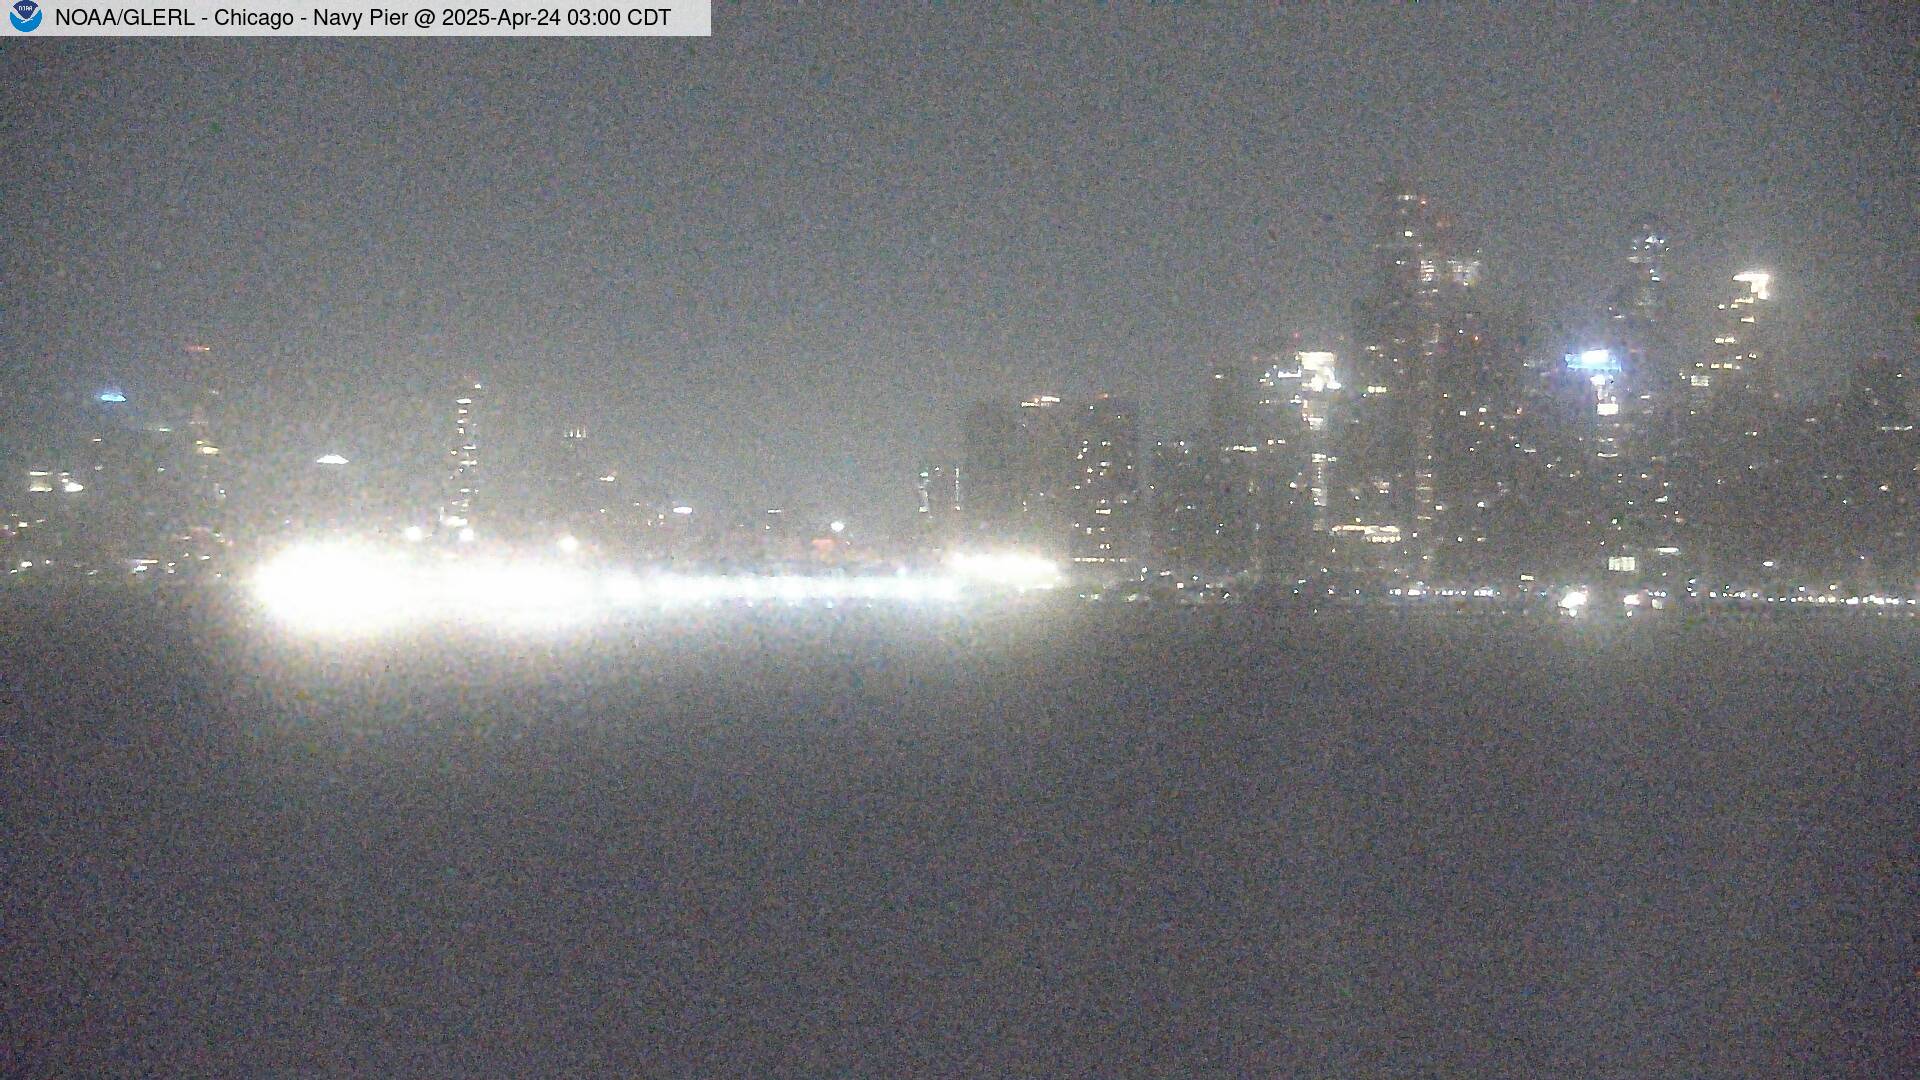
The URL may have changed and you need to go to the Harrison Dever Crib and Webcam Four Mile Crib (GLERL/NOAA) to see all three. 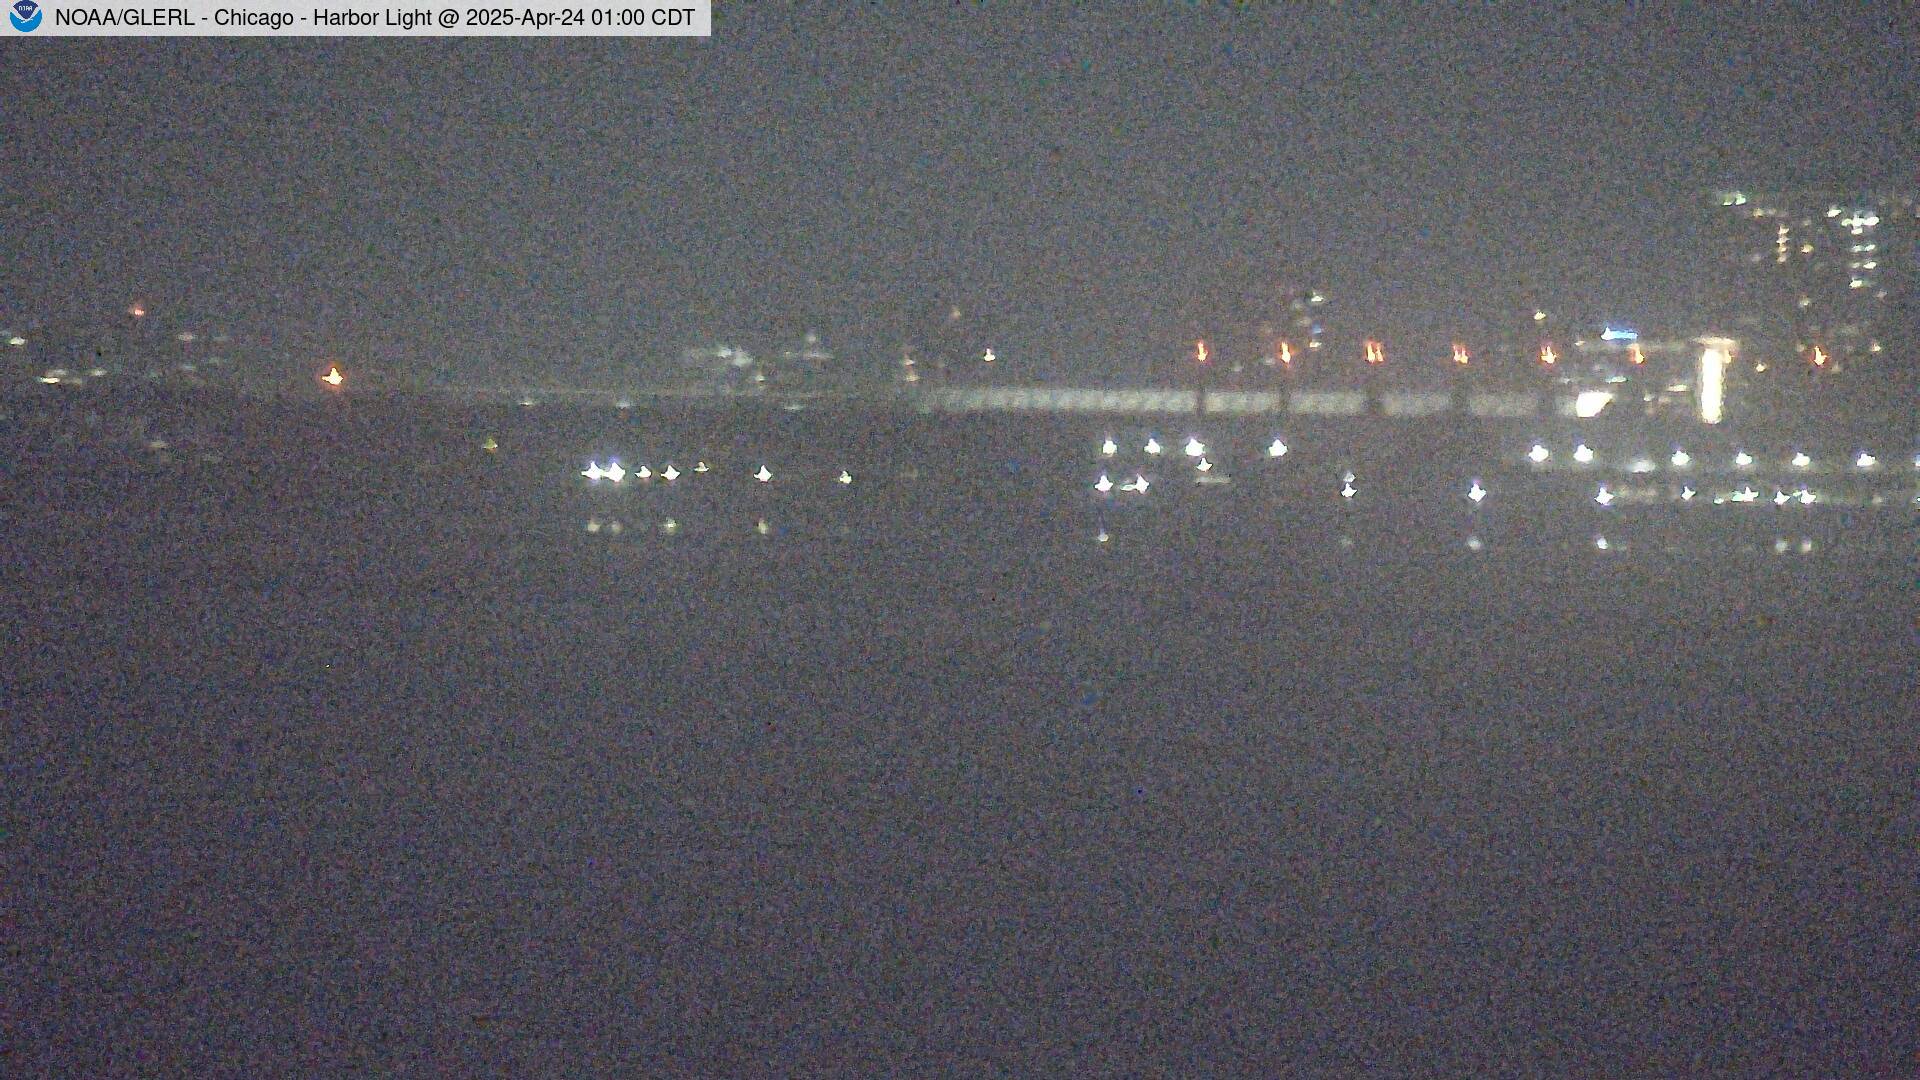
Wilmette Webcam 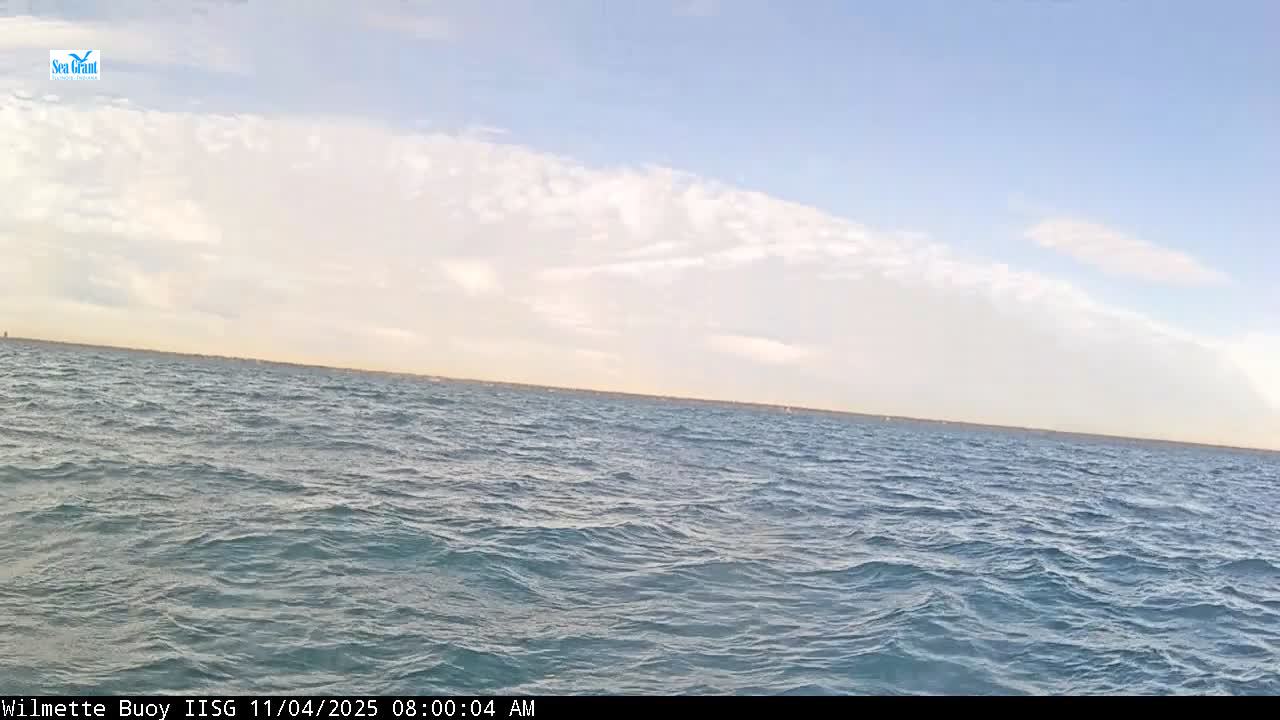
Lake Off Navy Pier Webcam 
- Links to Buoys -- You Can Even Text
- Off Navy Pier Buoy 45198
- Navy Pier Mobile
- Navy Pier Text 45198 to 8662189973 (backup 7344187299)
- 8662189973 45198 (backup 7344187299)
- Wilmette Buoy 45174
- Wilmette Mobile
- Wilmette Text 45174 to 8662189973 (backup 7344187299)
- 8662189973 45174 (backup 7344187299)
Motion Sickness Test! GLERL Waves https://www.glerl.noaa.gov/emf/waves/WW3
NOAA Great Lakes Satellite https://www.star.nesdis.noaa.gov/goes
: 

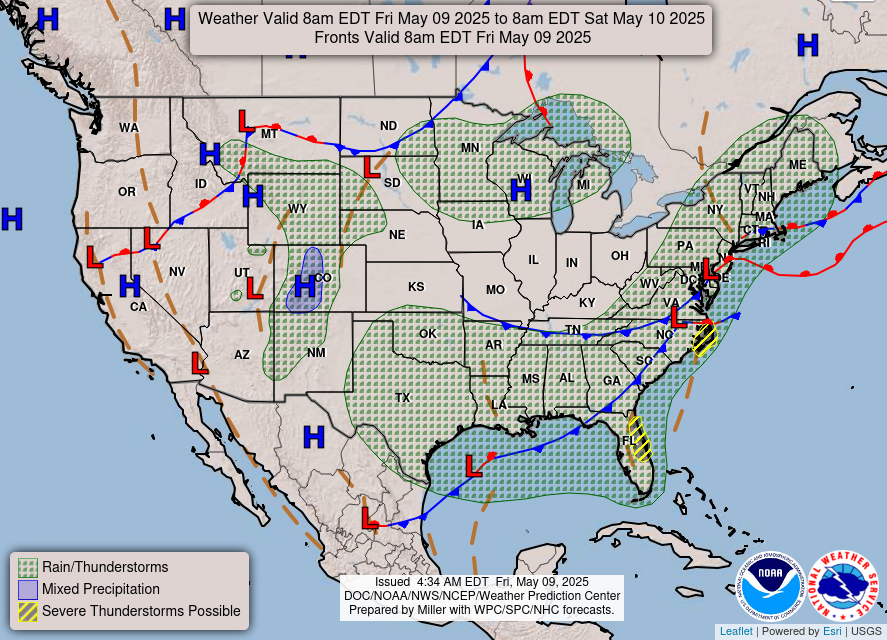
Simplifed NOAA Weather Map http://www.wpc.ncep.noaa.gov
NOAA North America Surface Analysis http://www.wpc.ncep.noaa.gov
NOAA Surface Analysis Central US North https://www.wpc.ncep.noaa.gov/sfc/namncsfcwbg.gif
United States (CONUS/color background) https://www.wpc.ncep.noaa.gov/sfc/bwsfc.gif
- NOAA Surface Analysis with Radar
- Satellite and Surface Analysis and Radar
- NOAA Radar
Select Location to Zoom in to your Location
- NOAA Satellite Page
- NOAA Great Lakes Satellite Page
- NOAA Hurricane Center Satellite Page
Oceanic, Does Not Appear to Include Central US (No Hurricanes!)
Same As the VHF Broadcast in Print - IF NOT DISPLAYED
- CLICK HERE,
- DRAG SCROLL BOX ON SCROLL BAR DOWN TO VIEW ENTIRE FORECAST
If the one above does not display, use this one.
Different URL for NWS Marine Forecasts FZUS53
- Forecasts
00 Hours 06 Hours 12 Hours 18 Hours 
24 Hours 36 Hours 48 Hours (Two Days) Loop 
- Five Day Forecast
- https://www.wpc.ncep.noaa.gov/medr/medr.shtml
Day 3 Day 4 Day 5 
Day 6 Day 7 DAYS 3 - 7 

In the old days, forecasts were printed on teletype machines. Essentially, these were "texts", although printed with keys striking ribbons on paper, the paper being automatically fed, responsive to remotely generated signals.
Date Time (Local)
Wind (MPH)
Vis (MI)
Weather Sky Cond
Temp Air
Temp Dwpt
Temp 6 Hr
Max
Temp 6 Hr
Min
Rel Humid
Wind Chill
Heat Index
Pressure In Hg
Pressure (mB)
Precip 1 HR
(IN)
Precip 3 HR
(IN)
Precip 6 HR
(IN)
......... ............ ........... ........ ............... .......... ......... ......... .......... .......... ............ ......... .......... ........... ........... ........... ........... . ..........
.
Here it is for O-Hare (ORD) -- Close to Due West from Montrose Harbor
https://metar-taf.com/KORD
Here it is for Midway (MDW) -- Close to Due West from Jackson Park Harbor
https://w1.weather.gov/data/obhistory/KMDW
You can make important interpretations yourself from this data of hourly conditions, if you look at the right things.
a. If I see Pressure falling dramatically over the past, say, four to six hours, I know to consider there may be trouble coming. Remember the old ship's captain looking at the barometer?
......... ............ .....
........... .....
........ .....
............... .......... .....
......... .....
......... .....
.......... .....
.....
.......... .....
.....
............ .....
......... .....
.......... .....
Pressure In Hg
Pressure (mB)
........... .....
.....
........... .....
.....
........... .....
.....
b. If I see Air Temperature and Dewpoint are really close and high relative humidity I know it’s probably going to be foggy.
......... ............ .....
........... .....
........ .....
............... .......... .....
Temp Air
Temp Dwpt
.......... .....
.....
.......... .....
.....
Rel Humid
......... .....
.......... .....
.............. ..........
.............. ..........
........... .....
.....
........... .....
.....
........... .....
.....
c. If I see wind direction shifting, that’s a good indication of movement of a high or low pressure area (Pressure could help determine which).
Often comparing interrelated conditions (Direction and Pressure?) can permit interpretation of bigger changes.
Of course if you're a racing sailor, you've already been watching this, because it often shifts back and forth, locally, as oscillating shifts, or it's a persistent shift.
29.92 in Hg = 1013.21 mbar
......... ............ .....
Wind (MPH)
........ .....
............... .......... .....
......... .....
......... .....
.......... .....
.....
.......... .....
.....
............ .....
......... .....
.......... .....
Pressure In Hg
Pressure (mB)
........... .....
.....
........... .....
.....
........... .....
.....
d. Visibility (see foggy, above) is a direct observation and is a basic safety factor in deciding what you can see and avoid.
It might help you judge if you should be able to see that ATON ("Aid To Navigation"), or not.
You should have spent some time learning the calculations for distance from an ATON based on its elevation, your height of eye, and curvature of the Earth.
If you didn't, maybe brush up on navigation.
But if visibility is not far enough to spot the ATON
And, of course, it lets you double check your conclusion from Temperature and Dewpoint.
......... ............ .....
........... .....
Vis (MI)
............... .......... .....
Temp Air
Temp Dwpt
.......... .....
.....
.......... .....
.....
Rel Humid
......... .....
.......... .....
.............. ..........
.............. ..........
........... .....
.....
........... .....
.....
........... .....
.....
e. You might like to see those cute cartoon clouds with raindrops on your phone.
But if you see Precipitation in Inches over one, three and six hours, and it's going up, down or has stopped, you can make a pretty good extrapolation about what's going to happen. Just not as cute. Like Wind Direction and Pressure, it's Changes that provide great insight.
......... ............ .....
........... .....
......... ............... .......... .....
......... ......... .......... .....
.....
.......... .....
.....
......... ......... .....
.......... .....
.............. ..........
.............. ..........
Precip 1 HR
(IN)
Precip 3 HR
(IN)
Precip 6 HR
(IN)
f. The only confusing thing if you're not an aircraft pilot is that "Pressure - Altimeter" is local air pressure in Inches Mercury, and "Pressure - Sea Level" is local air pressure in millibars.
The reason to call it "Altimeter" is that an airplane altimeter doesn't measure altitude. You set it to the Inches Mercury at a desired airport, and the altimeter measures pressure where you are located (up in the air it's nearly always lower) but the instrument converts the pressure difference to display "feet" in altitude to make it easy to read. But if pressure has changed at the destination, your indication could be too high or low. Pretty important if you're 200 feet above ground and a radio tower is 190 feet tall.
Lake Michigan, near Chicago, of course, is about 577 feet above sea level, (Low Water Datum Lake Michigan 9087044 Calumet Harbor, IL = 176.0 m. 577.5 ft.) and the readings are at a station, so O'Hare (ORD Elevation: 680 ft.) or Midway (MDW Elevation: 619.8 ft.) are all measured at a higher location.
If you're a boater, you pretty much want to stay on the surface, anyway, and its really changes in surface pressure over time that are important for you.
- Other Links for Water Conditions
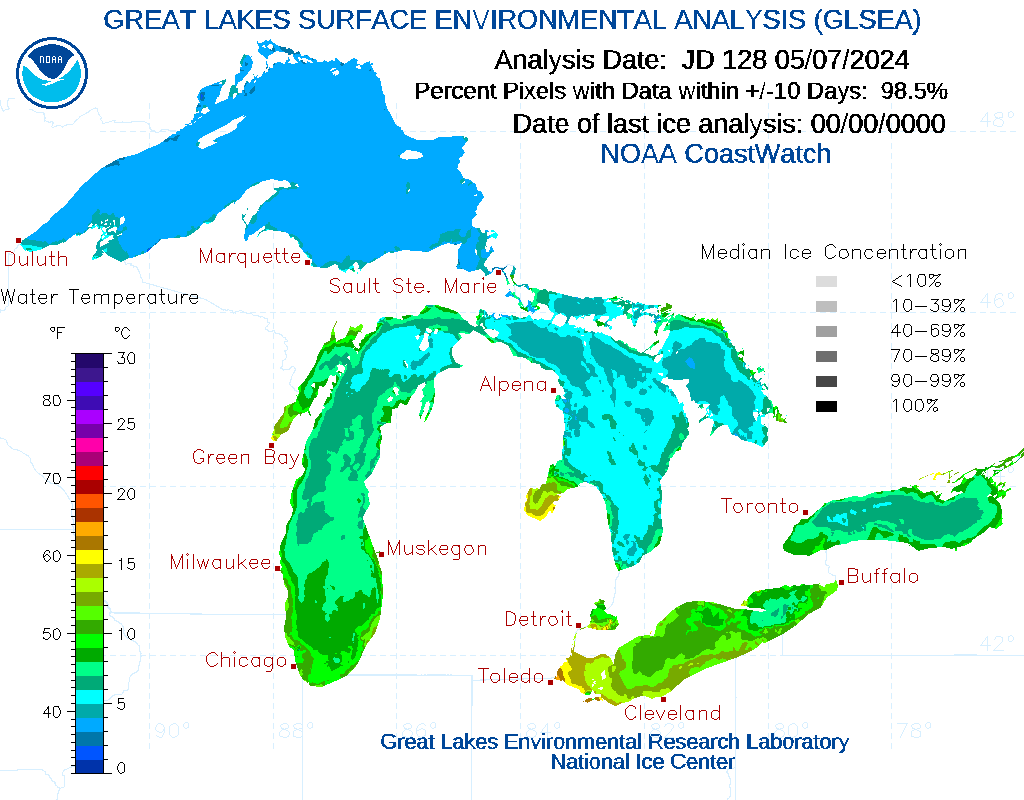
- GLERL Water Temperature
NWS Great Lakes Portal
- Water Level
Army Corps of Engineers 
GLERL Great Lakes Water Level GLERL Great Lakes Water Level Observations https://www.glerl.noaa.gov/data/wlevels/#observations
Collected GLERL Links GLERL Lake Michigan Huron Note: Low Water Datum Lake Michigan 9087044 Calumet Harbor, IL = 176.0 m. 577.5 ft. GLERL Observations 2 OnlineENC Chart See if you can find Diversey Bridge Clearance 4.2 m = 10.68 feet
ENC Chart Viewer And Also Note: If you have downloaded NOAA charts to a chartplotter, they may show clearance v. Low Water, not "real time" considering Low Water, not "real time" considering actual lake level
Chicago River “Gage Height” Is whether the water level is high CHICAGO RIVER AT CHICAGO LOCK AT CHICAGO, IL 05536123 - https://waterdata.usgs.gov/il/nwis/uv/?site_no=05536121&PARAmeter_cd=00065,00060
Next Generation 7 Day Graph CHICAGO RIVER AT COLUMBUS DRIVE AT CHICAGO, IL 05536137 https://waterdata.usgs.gov/il/nwis/uv/?site_no=05536123&PARAmeter_cd=00065,00060
CHICAGO S & S CANAL AT WESTERN AVE AT CHICAGO, IL 05536121 https://waterdata.usgs.gov/il/nwis/uv/?site_no=05536137&PARAmeter_cd=00065,00060
Chicago River Water Quality Combined Conditions
https://www.glerl.noaa.gov/res/glcfs/glcfs.html
GLERL Page for Various Reports Wind and Waves https://www.glerl.noaa.gov/metdata/ Lake Michigan -- Check Off Data to Show GLERL Surface Air and Water Temperature Water Temperature at the Bottom Wind

Waves

Air

Water


Currents Check the Buoys -- Wilmette Below 
- Radar
Shows Precipitation and Cloud Build Up,
Speed Storms Are Moving, Growing
- see https://preview.weather.gov/
- Opening Page for Whole US, Click Radar and Zoom
- Enhanced Display Might Pick Up Your Computer's Location
- see https://radar.weather.gov/
- Coded for Chicago
- NWS Doppler Radar
- https://www.weather.gov/crh/radar
- Weather Underground - Intellicast Radar Summary https://www.wunderground.com/maps/radar/current#
- This Guy Has Advertising and Displays The Radar Directly
- Be Sure It Doesn't Hijack Your Browser
- https://livewxradar.com/
- Other Links
- Water Levels - Calumet
- GLERL Wind Forecast Gateway
- Short Range Forecast 6 Hour Intervals
- 3 - 7 Day Forecasts
- NOAA 4 - 7 Day Gridded Forecast Maps (GRIdded Binary) Shows Temperature Forecasts
- Tides and Currents Page
- Animated currents
- Short Range Forecast
- Chicago Forecast
- Other Places
- Milwaukee
- Washington Island, WI Forecast
It Looks Like You Can Write the Code
Using your Latitude and Longitude https://forecast.weather.gov/MapClick.php?lat=45.3946&lon=-86.9312
- Wind, Wave, Current Forecasts
- Sail Flow Wind Forecast
- Sail Flow for Chicago
- Watch Out that Sail Flow Doesn't Hijack Your Page
Windalert This One Has Forecasts Displayed Graphically And More If You Click 
"Believe me, my young friend, there is
nothing, absolute nothing,
half so much worth doing as
simply messing about in boats"
Capt. David C Brezina
USCG Licensed Master, 25 Ton and Sail Endorsements
Past Secretary, Chicago Harbor Safety Committee
Past Commodore, Chicago Corinthian Yacht Club
dbrezina-uic@outlook.com
2/12/2025
16 CFR Part 255 Notice: Sites marked with an
X (if any) said they might send some swag

